21.NetData
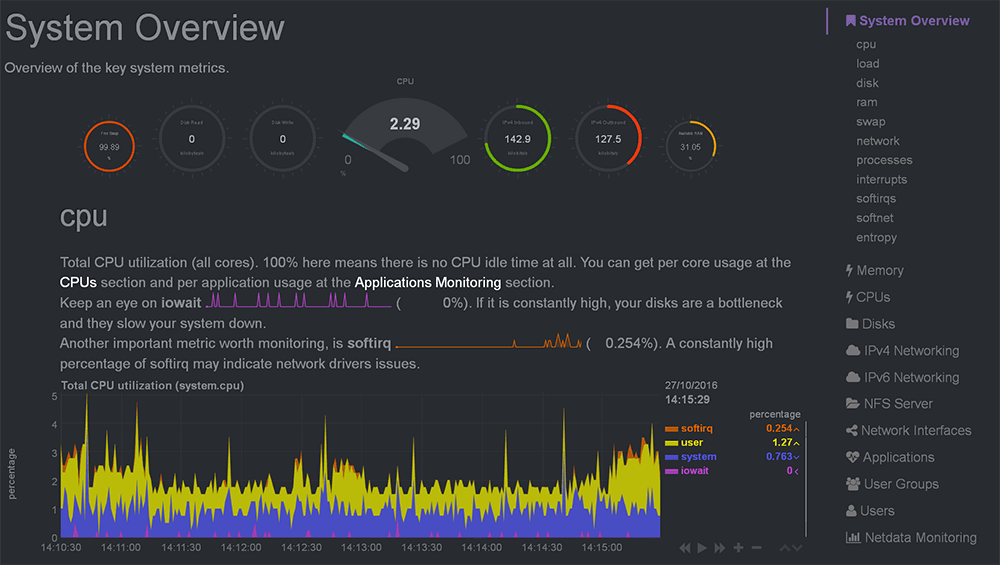
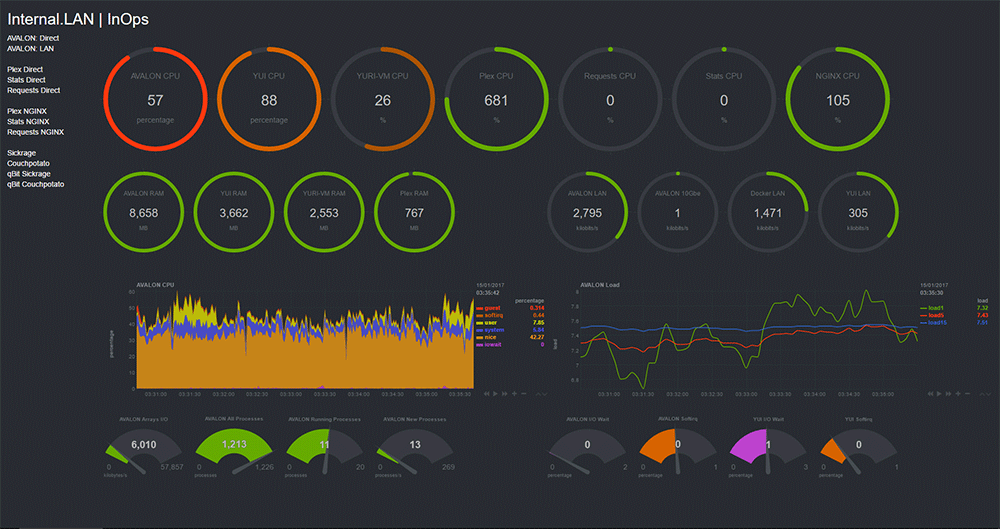
netdata is a scalable, distributed, real-time, performance and health monitoring solution for Linux, FreeBSD and MacOS.
Everything netdata does is per-second. The web dashboards are real-time and interactive. netdata achieves this, by splitting the work load, between the server and the dashboard client (i.e. your web browser). Each server is collecting the metrics and maintaining a very fast round-robin database in memory, while providing basic data manipulation tasks (like data reduction functions), while each web client accessing these metrics is taking care of everything for data visualization.
Out of the box, it collects 1k to 5k metrics per server per second. It is the corresponding of: top, vmstat, iostat, iotop, sar, systemd-cgtop and a dozen more console tools running in parallel. netdata is very efficient in this: the daemon needs just 1% to 3% cpu of a single core, even when it runs on IoT.
For big setups, netdata can archive its metrics to graphite, opentsdb, prometheus, kairosdb, influxdb, etc. This allows enterprises with dedicated departments and infrastructure to use netdata for data collection and real-time alarms.
netdata alarms can be setup on any metric or combination of metrics and can send notifications to:
- email addresses
- slack channels
- discord channels
- pushover
- pushbullet
- telegram.org
- pagerduty
- twilio
- messagebird
Alarms are role based (each alarm can go to one or more roles), roles are multi-recipient and multi-channel (i.e. sysadmin = several email recipients + pushover) and each recipient may filter severity. You can also add more notification methods quite easily.
22. NetXMS
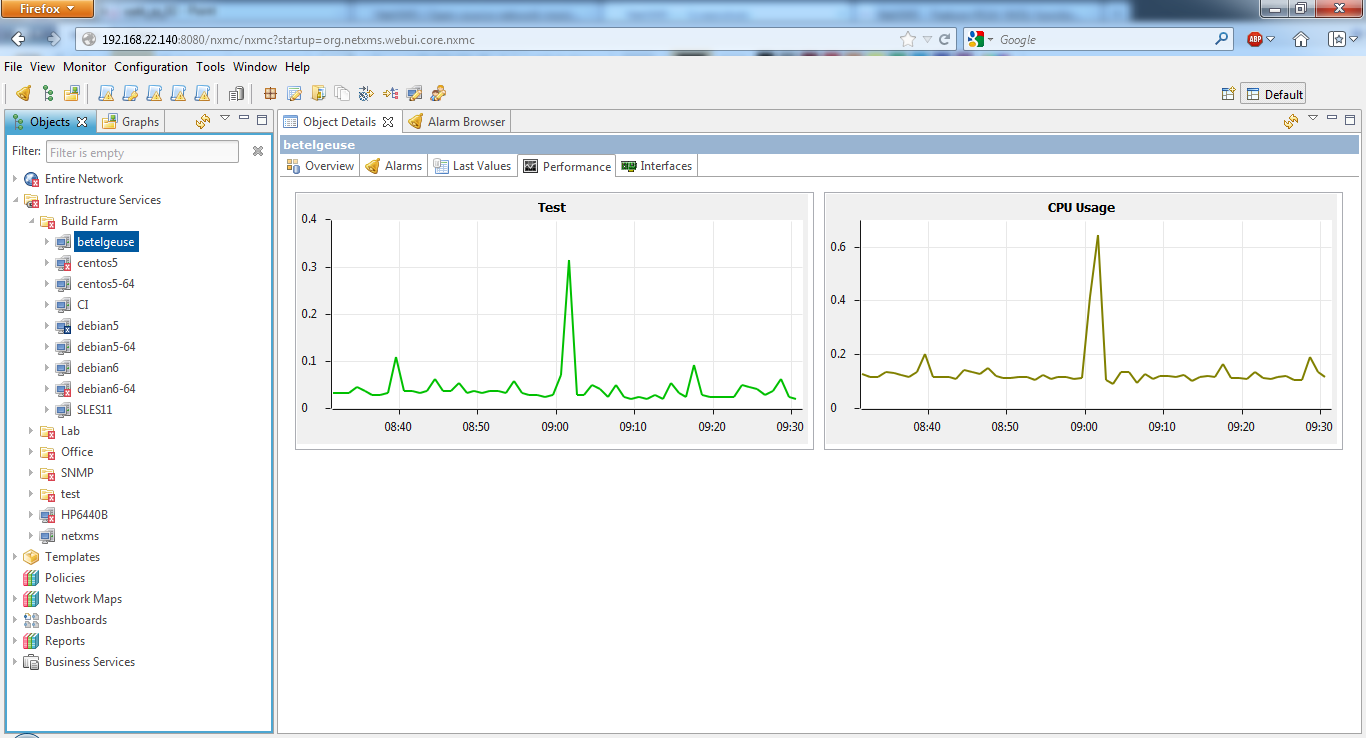
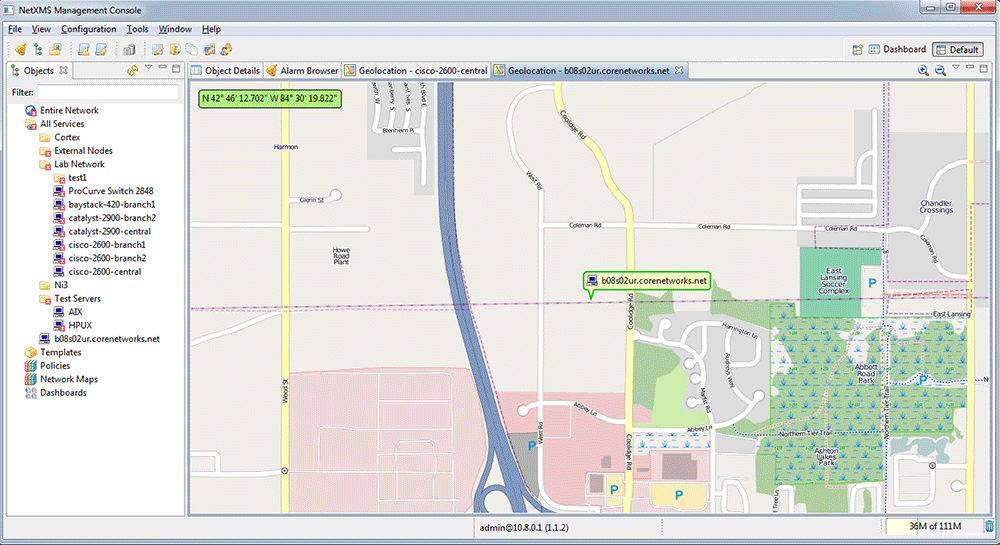
NetXMS is an enterprise grade multi-platform open source network management and monitoring system. It provides comprehensive event management, performance monitoring, alerting, reporting and graphing for all layers of IT infrastructure — from network devices to business application layer.
The system has three-tier architecture: the information is collected by monitoring agents (either our own high-performance agents or SNMP agents) and delivered to monitoring server for processing and storing. Network administrator can access collected data using rich client application or web interface.
23. ntopNG
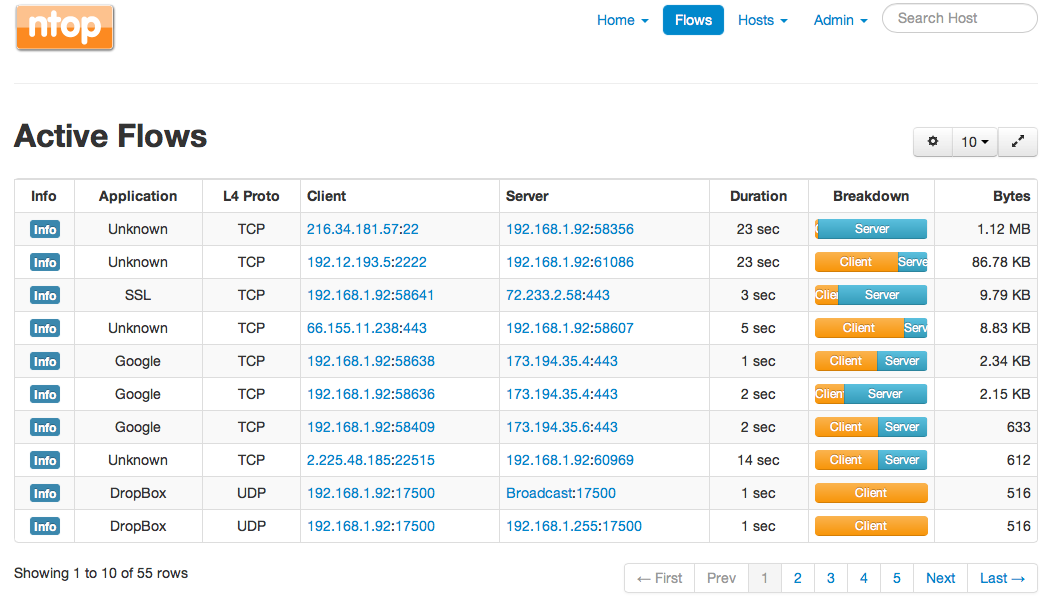
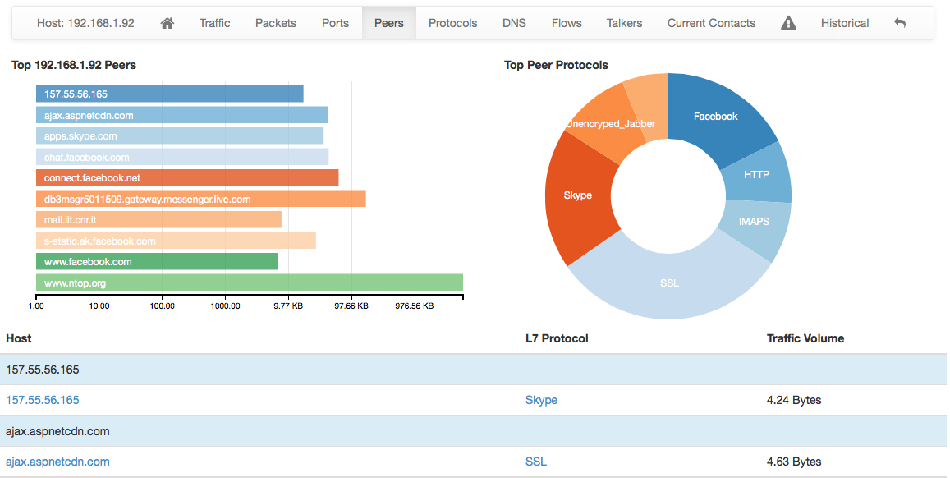
ntopNG, the next generation version of the original ntop, a network traffic probe that shows the network usage, similar to what the popular top Unix command does. ntopng is based on libpcap and it has been written in a portable way in order to virtually run on every Unix platform, MacOSX and on Win32 as well.
ntopNG users can use a a web browser to navigate through ntop (that acts as a web server) traffic information and get a dump of the network status. In the latter case, ntop can be seen as a simple RMON-like agent with an embedded web interface.